Spaghetti Bridge Lab
- Mark Schober

- Aug 7, 2020
- 4 min read
Updated: Apr 29, 2021
I start the year in 9th grade physics with a series of short lab investigations emphasizing lab techniques. Developing student fluency in data collection and analysis prepares them to devote their mental energies to understanding physics principles in subsequent labs.

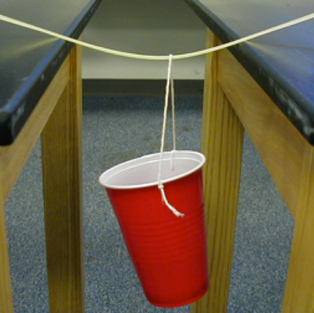
I use the spaghetti bridge lab to let my new class of students to show me what they can do: take data so that you can predict the number of masses that could be supported by a bridge made of strands of pasta.
I used to provide a lot of guidance so that the students would get "good" data, but I've found that the less guidance I give, the greater the variety of student approaches (both good and bad) and the richer the post-lab discussion. After all, this lab isn't about developing a critical physical principle, it's about experimental design, communication, and setting a community norm that "answers" are based on patterns in data taken in a justifiable manner -- not on what the teacher says.
This activity provides a great environment for discussing independent, dependent and control of variables. Depending on the level of your students, some might graph their data and write an equation for the graph, and the spaghetti bridge lab is a nice situation to use because the slope and y-intercept have accessible physical meanings.
Materials:
Uncooked long-strand spaghetti, thick and thin
Large plastic cups or small cans.
String to make a handle on the cup/can to attach to the bridge
Unit masses: Marbles, washers, hex nuts, or pennies. I found some decorative squashed glass marbles -- they don't roll far when they hit the floor.
Lab Procedure Notes:
[] Depending on your comfort level, don't be afraid to let the students come up with their own procedures. The important thing is for every group to explain their procedure in the post lab discussion. During this discussion ideas will emerge about how best to collect, display, and interpret the data.
[] Let the students make mistakes -- but remind them to keep notes on how they collect their data.
[] If you use marbles, have each group assign a "catcher" for the cup, otherwise there will be potentially dangerous marbles scattered all over the floor.
Post Lab Discussion:
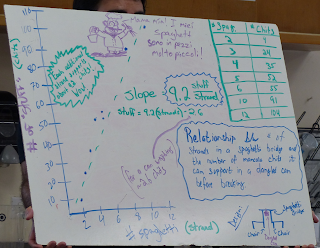
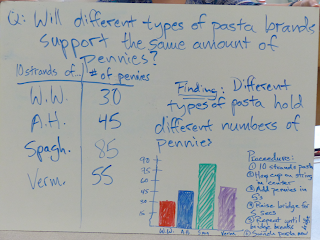
Ask the students show their procedure and represent the pattern they found on large whiteboards. Choose one of the groups with a weaker board to go first. Ask the rest of the class to identify well-done elements on each board and to explain why those elements their communicate procedure and results well. As you make it to stronger boards, also ask the class for suggestions for making the data collection and presentation of data even stronger. You might assign a student to record items that the class feels are important to conducting a good experiment and presenting data clearly.
Example whiteboards:
Example questions: Experimental procedure questions: What was your procedure? Is the procedure clearly shown on the whiteboard? What was your independent variable? What was your dependent variable? What is meant by control of variables? How did you control variables? Why did you control variables? How is a dependent variable different from an in dependent variable? How did you know you had collected enough data? What is the advantage of doing multiple trials? Questions about the presentation of results: What are the features of a good data table? How did you convey the pattern you found? Use your pattern to determine the number of masses that could be supported by 10 (for example) strands of pasta. The whiteboard is a visual aid. What representations are most helpful in conveying what you did and what you found? Questions about the graphical analysis of data: (see the graphical analysis discussion below) What kind of graph best represents your data? Explain why you graphed this variable on the vertical axis and that variable on the horizontal axis. What does the straight-line graph tell you about the bridge? What does the y-intercept mean in terms of your bridge? How do you determine the units of the slope? What does the slope of your graph tell you about your bridge? Why do different groups have different values for their slopes? What variables affect the size of the slope? Under what conditions might you get a larger slope? What parts of the equation should have units and what parts of the equation do not have units? Graphical Analysis: Students graphing their data will find it to be pretty linear. draw a best-fit line, and determine the slope and y-intercept of their line. Students should be asked to write an equation for their graph. You may need to remind them of the general form of the equation for a line, y = mx + b. Example equation for load measured in marbles and strength measured in strands: (load) = 8 marbles/strand * (strength) - 5 marbles The slope tells how many marbles are supported by each strand of pasta. If the students use the word “per” or “over” be sure to ask them explain what the slope means without using per and over. For example, students should be able to explain that 8 marbles/strand means each additional pasta strand can support 8 additional marbles. The negative y-intercept is interesting and tricky. Students may notice that heavier marble cups result in larger, more negative y-intercepts. Lead students to observing that the strands never supported quite as many marbles as the slope would predict. Asked what else is putting a load on the bridge, students recognize that the weighted cups put a load on the bridge about the same size as their y-intercept. Therefore, the equation can be interpreted to mean that several strands of strength may be needed to support the cup before any marbles can be added. An equally fruitful discussion arises from describing the meaning of the x-intercept. An essential conclusion for students to reach about the graph is that the constants in the graph: slope and y-intercept, have physical interpretations related to the physical experimental setup.
Originally posted on my previous website August 2, 2017.


Comments